
Facebook advertising often feels deceptively simple: launch ads, watch clicks come in, and assume growth is happening. In reality, rising numbers can hide stagnation or even declining efficiency. To understand whether your Facebook ads are actually improving, you need to look beyond surface-level metrics and evaluate performance in context.
This guide breaks down the most reliable ways to measure improvement, supported by industry statistics and practical benchmarks.
Look at Performance Trends, Not Isolated Results
Single-day or single-week results rarely tell the full story. Real improvement shows up as consistent trends over time.
Focus on at least 30–60 days of data and compare:
-
Cost per result (lead, purchase, or signup)
-
Conversion rate trends
-
Frequency and engagement stability
According to Meta benchmarks, advertisers who evaluate performance in multi-week windows are up to 23% more likely to identify sustainable improvements rather than short-term fluctuations.
If costs spike briefly but normalize at a better level than before, that can still indicate progress.
Cost Per Result Is More Important Than Clicks
Click-through rate (CTR) and impressions can increase while results stay flat. Improvement means paying less for meaningful actions.
Key indicators of real progress include:
-
Decreasing cost per lead or acquisition
-
Stable or increasing volume at the same cost
-
Lower cost per result while maintaining quality
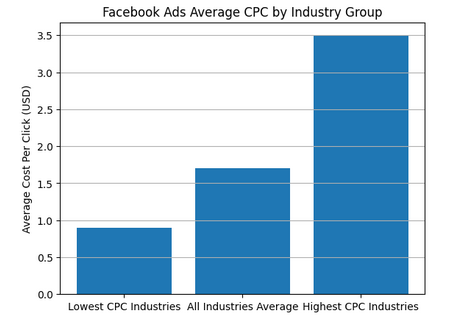
Facebook Ads average cost per click benchmarks by industry
Industry data shows that top-performing Facebook advertisers reduce cost per acquisition by an average of 18–26% through optimization, even when traffic volume remains unchanged.
If your ads generate more clicks but your cost per lead rises, performance is not improving.
Conversion Rate Tells a Deeper Story
A rising conversion rate often signals better targeting, messaging, or creative alignment.
Track:
-
Landing page conversion rate
-
Lead form completion rate
-
Purchase conversion rate
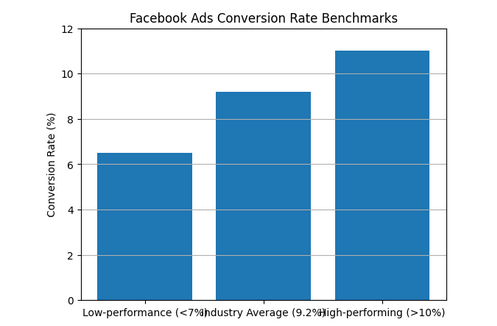
Comparison of Facebook Ads conversion rate benchmarks showing average and performance targets
Across industries, the average Facebook ad conversion rate is around 9.2%, but high-performing campaigns often exceed 12–15%. Consistent upward movement in conversion rate is one of the clearest signs that ads are improving.
Watch Frequency and Ad Fatigue
Improvement is not just about cost efficiency. Sustainable performance matters.
When frequency rises above 2.5–3.0 in short timeframes, engagement and conversion rates often decline. Meta’s internal data shows that ad fatigue can increase cost per result by over 30% once audiences are overexposed.
If performance remains stable while frequency increases slowly, your creative and targeting are likely improving.
Measure Downstream Impact, Not Just Platform Metrics
Facebook’s dashboard shows platform-level success, but true improvement appears further down the funnel.
Evaluate:
-
Lead quality and sales acceptance rates
-
Cost per qualified lead
-
Revenue per customer acquired
Advertisers who track post-lead outcomes report up to 41% better budget allocation decisions compared to those relying only on in-platform metrics.
If downstream quality improves while costs remain steady, your ads are becoming more effective—even if surface metrics change only slightly.
Compare Against Your Own Baseline, Not Industry Averages
Benchmarks are useful, but improvement is relative to where you started.
Ask:
-
Are results better than last month?
-
Is efficiency improving quarter over quarter?
-
Are fewer resources generating the same or better outcomes?
Consistent incremental gains of 5–10% per optimization cycle often compound into major performance improvements over time.
Common Signs Ads Are Not Actually Improving
Be cautious if you notice:
-
Rising spend with flat results
-
Higher CTR but lower conversion rate
-
More leads with declining quality
-
Short-term wins followed by rapid performance drops
These patterns usually indicate surface-level optimization without real impact.
Conclusion
Facebook ads are actually improving when they deliver more value at equal or lower cost, maintain performance as scale increases, and generate better downstream results. By focusing on trends, cost efficiency, conversion quality, and long-term sustainability, you can clearly distinguish real progress from misleading growth.
