
Many advertisers still chase short-term metrics — clicks, impressions, even day-one ROAS — but those numbers only tell part of the story. If your goal is sustainable profit, you need to pay attention to metrics that predict performance months ahead, not just during the campaign’s first few days.
These are the ad metrics that reveal real growth and long-term profitability, with examples and practical insights from real-world campaigns.
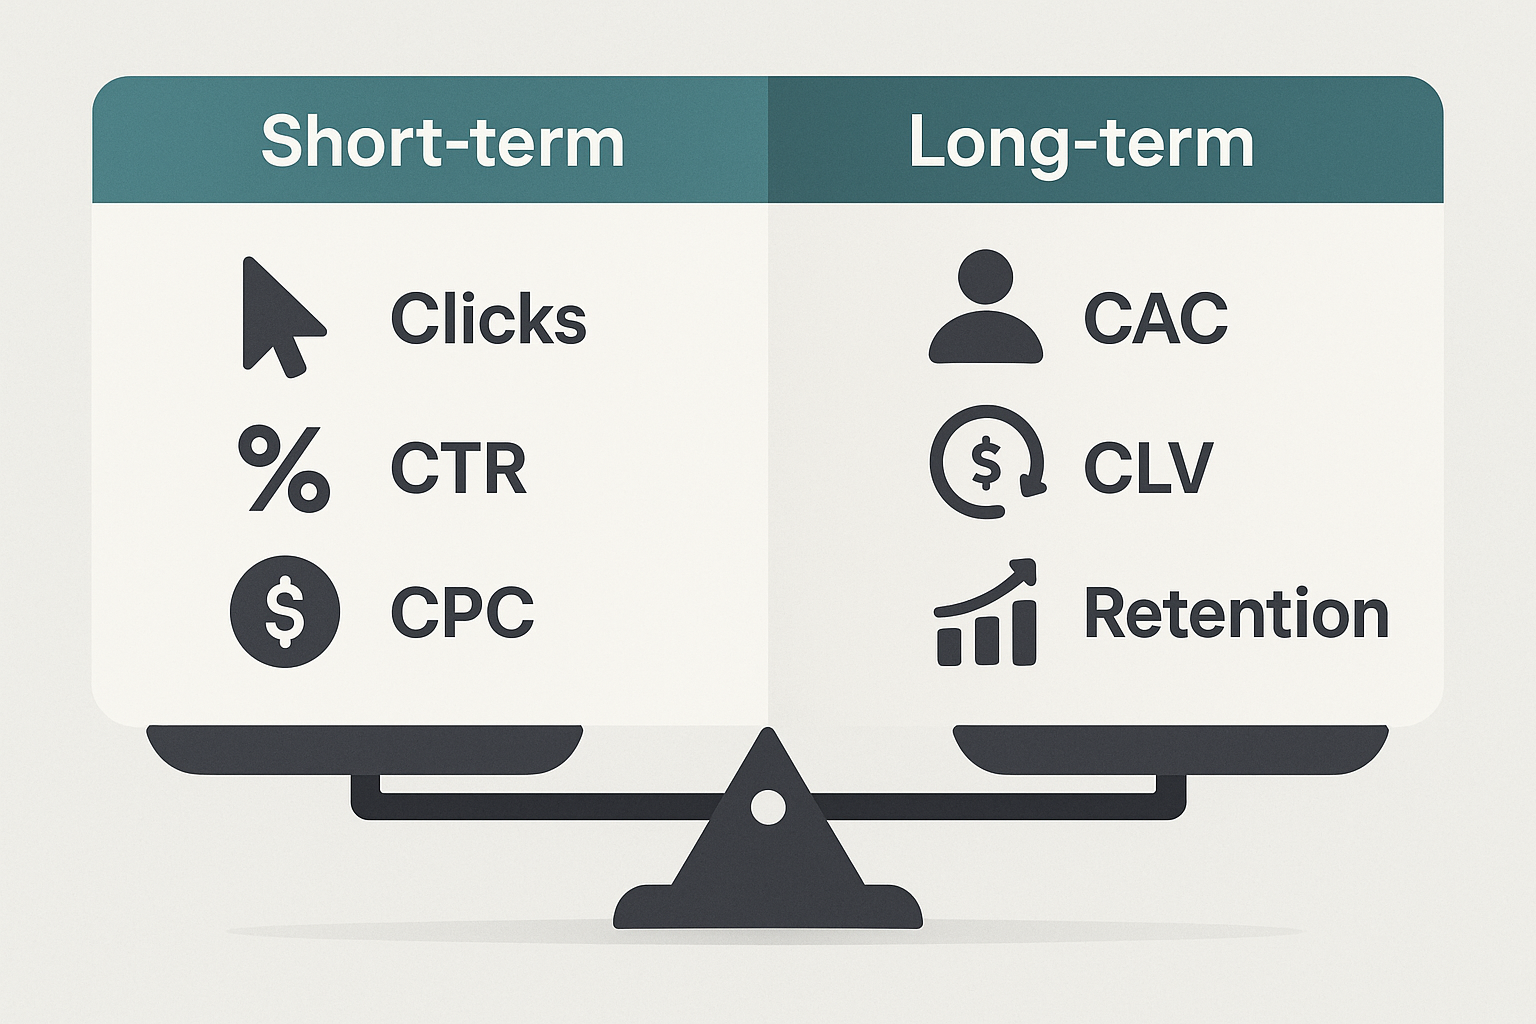
1. Customer Acquisition Cost (CAC)
Customer Acquisition Cost (CAC) tells you how much it costs to win a new customer. It’s simple but powerful — the first signal of efficiency in your funnel.
If your CAC rises while revenue holds steady, it may point to poor targeting or audience exhaustion. But if CAC rises alongside Customer Lifetime Value (CLV), that’s a sign of a healthy, scaling business.
How to analyze CAC effectively:
-
Segment by audience type. Compare acquisition costs between cold, warm, and retargeting audiences. You’ll often see huge differences in efficiency.
-
Watch cost trends after scaling. Many advertisers see CAC double once they increase budgets. That often means your best-performing segments are maxed out — here’s how to spot that early.
-
Adjust based on funnel stage. Prospecting campaigns always have higher CACs than remarketing, but they’re essential for long-term growth.
A great practice is to visualize CAC alongside conversion rate trends — it helps you see whether changes are coming from targeting, offer quality, or creative fatigue.
2. Customer Lifetime Value (CLV)
CLV shows how much each customer is worth over their relationship with your brand. It’s not just a number for your finance team — it’s a forecasting tool.
A brand with a high CLV can afford to outbid competitors, tolerate rising CPMs, and still stay profitable. That’s why many advanced advertisers pair CLV and ROAS for a clearer performance picture — this guide breaks down why the combination matters.
Practical ways to boost CLV:
-
Build retention campaigns that nurture customers after their first purchase.
-
Identify which products or services generate repeat buyers and feature them in awareness campaigns.
-
Track CLV across acquisition channels. For instance, Facebook buyers may have higher retention rates than TikTok buyers even if CAC is slightly higher.
A high CLV means you’re not just acquiring buyers — you’re building relationships that pay off again and again.
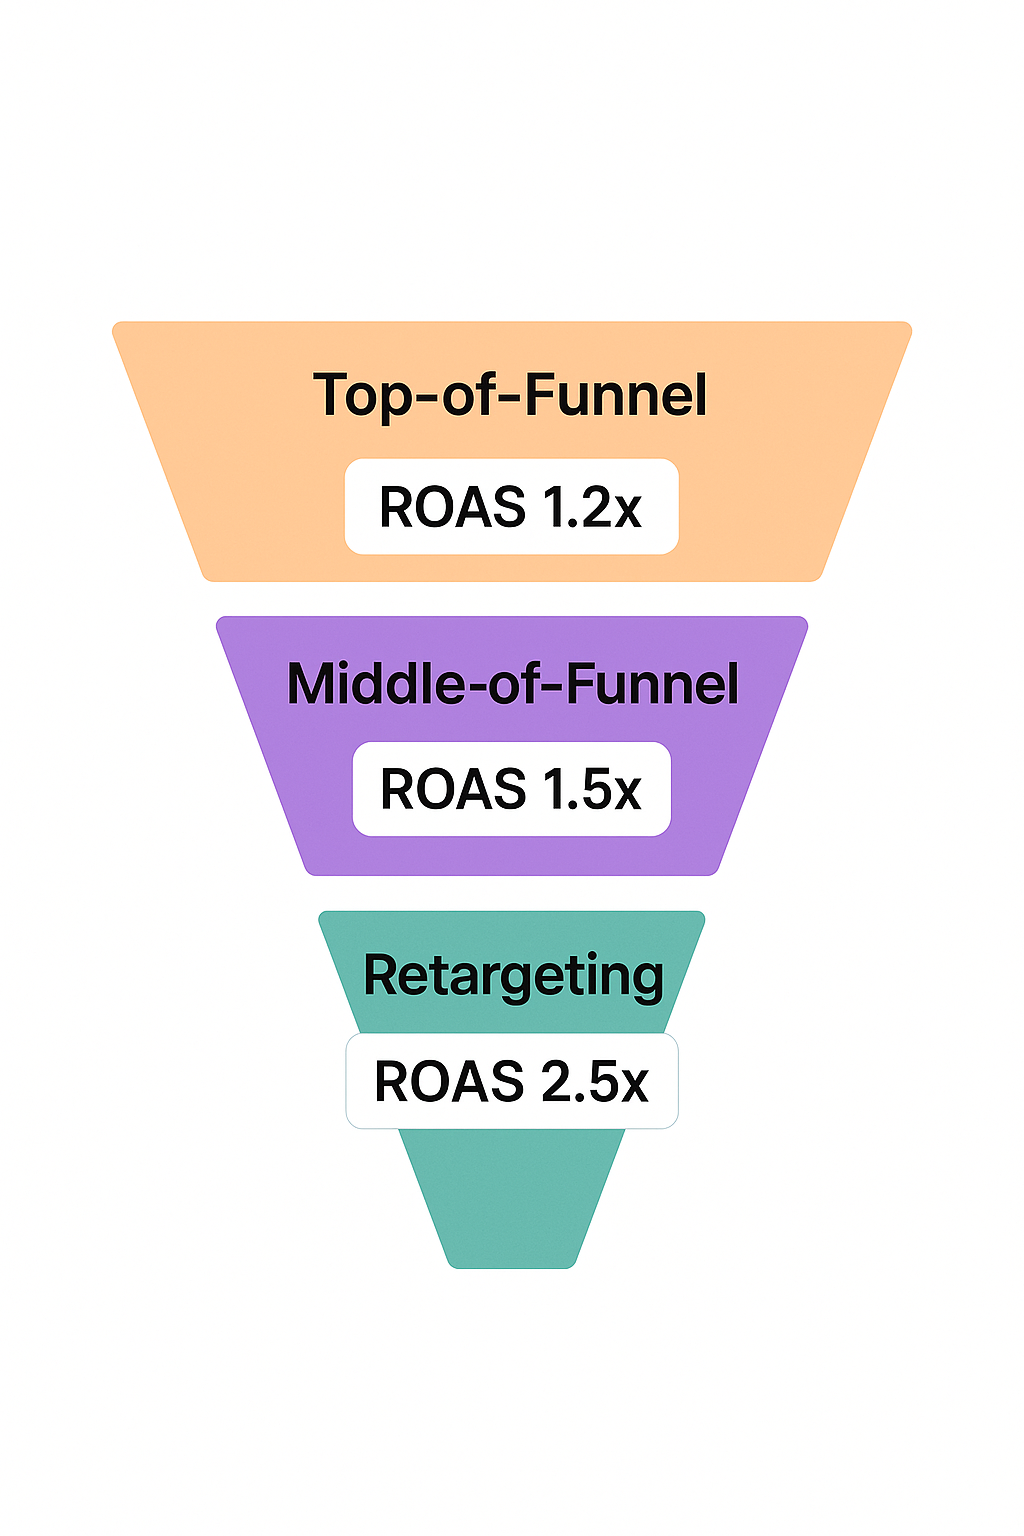
3. Return on Ad Spend (ROAS)
ROAS measures how much revenue each dollar of ad spend generates. It’s often the headline metric, but taken alone it can be misleading.
A campaign with a 5x ROAS might look perfect until you realize it’s driven by a limited retargeting pool that won’t scale. Conversely, a 1.8x ROAS on top-of-funnel ads could actually be the start of a strong long-term strategy.
To get more out of your ROAS data:
-
Compare short-term ROAS (7-day) with blended or 90-day ROAS. Many customers convert later through organic channels.
-
Measure incremental ROAS — how much revenue your campaign adds beyond what would have happened organically.
-
Monitor by product type. Some categories naturally yield lower ROAS but bring better repeat value.
If your ROAS remains steady or improves as spend increases, you’ve likely found a scalable audience mix. Learn how to maintain that balance here.
4. Engagement Rate
Engagement rate — likes, comments, shares, and saves — reflects how strongly your audience connects with your creative. High engagement usually precedes good conversion rates because it signals relevance to the algorithm.
A static ad with 1% engagement might look okay, but a carousel or video ad pulling 4–5% engagement often delivers cheaper conversions down the line.
To improve engagement quality:
-
Ask open-ended questions in your ad copy to invite interaction.
-
Experiment with user-generated or behind-the-scenes visuals instead of polished studio shots.
-
Track comment quality — genuine discussion outperforms generic emojis.
When engagement drops, it’s often a creative issue, not a targeting one. This breakdown on engagement tracking explains how to spot weak signals early.
5. Frequency and Fatigue
Frequency is how many times the average user sees your ad. Beyond 4–5 impressions, performance usually starts to slip as audiences tune out or feel spammed.
Tips to manage frequency:
-
Keep awareness campaigns between 2–4 exposures.
-
For retargeting, you can push up to 7–8 if creative varies.
-
Rotate visuals weekly and cap exposure manually if CPM rises without performance gains.
If you start seeing comments like “I keep seeing this ad,” you’ve likely hit fatigue. This guide on ad fatigue explains how to refresh before performance crashes.
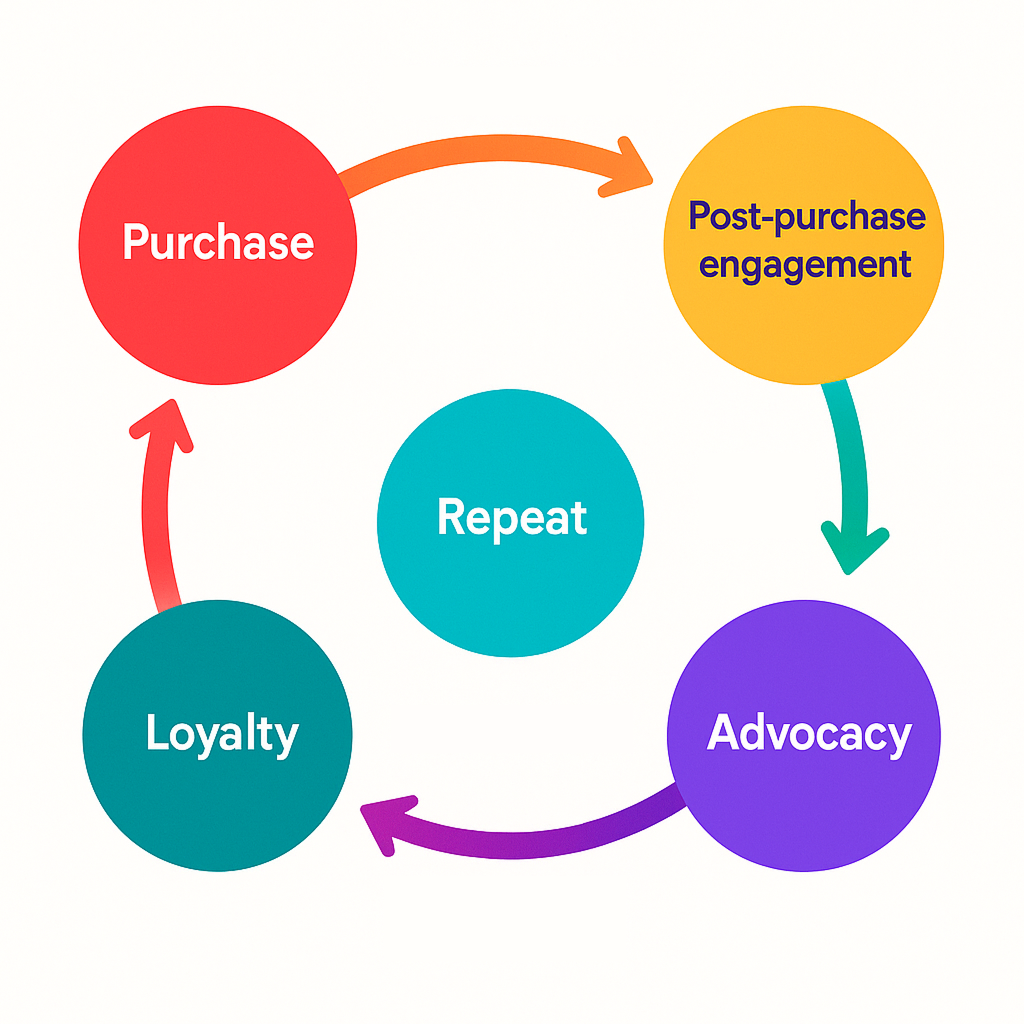
6. Retention and Repeat Purchase Rate (RPR)
Retention metrics measure how well your campaigns attract loyal customers rather than one-time buyers. A high repeat purchase rate means your offer aligns with customer expectations and experience.
How to measure retention health:
-
Track cohort data. Do customers from summer campaigns behave differently than holiday buyers?
-
Watch churn rate after major promotions — discounts often bring lower-quality customers.
-
Use post-purchase retargeting to upsell or cross-sell complementary products.
Campaigns that bring in repeat customers are worth more than those that win one-time purchases, even if the initial ROAS looks lower.
7. Lesser-Known Metrics That Predict Future Profitability
Some of the best forecasting signals are hidden in plain sight. These lesser-known metrics often predict success or decline weeks before the main KPIs catch up.
Key examples:
-
Time to First Purchase: The shorter the delay between first ad view and first order, the stronger your offer alignment.
-
Repeat Purchase Latency: How long customers take to buy again. A shorter gap signals better retention.
-
Creative Decay Rate: The percentage decline in CTR per week. A high decay rate means your ad is losing freshness fast — time to swap it out.
-
Add-to-Cart Ratio vs Purchase Rate: A big gap means friction in checkout or pricing mismatch.
-
Organic Search Lift: Track increases in branded search volume during campaigns. It indicates strong awareness spillover.
-
Customer Payback Period: How long before revenue covers CAC. Shorter periods allow faster reinvestment.
Tracking these metrics helps you understand how your campaigns will perform three months from now — not just this week. For more advanced analysis ideas, see How to Analyze Facebook Ad Performance Beyond CTR and CPC.
8. Conversion Quality
A high conversion rate means little if most of those conversions are low-intent. Lead quality is one of the most overlooked profitability predictors in digital advertising.
What to monitor:
-
Lead-to-sale conversion for service and B2B ads.
-
Refund or return rate per ad set for e-commerce.
-
Email engagement and unsubscribe rates post-purchase.
If your campaign delivers lots of conversions but low repeat value, you might be over-optimizing for quantity instead of quality. Learn how to balance both in Lead Quality vs Lead Volume: What Facebook Advertisers Need to Know.
Final Thoughts
Short-term metrics show you how your ads performed yesterday. Long-term metrics show whether your strategy will survive tomorrow.
By tracking CAC, CLV, engagement trends, and lesser-known indicators like latency and payback period, you can anticipate shifts in profitability before they hit your bottom line.
When you review your next campaign dashboard, look for signs of durability — stable ROAS, shorter purchase cycles, and repeat buyers. Those patterns tell you that your ads aren’t just performing; they’re compounding.
